The State Population and Excess Whiteness
 Whether public or private, schools have some responsibility for educating their residents. A school that is training more White students than are in the state population is failing to meet the diverse needs of its people. Puerto Rico and the District of Columbia are treated as States, Puerto Rico (2%) had the lowest percentage of non-Hispanic White students. Maine and Vermont (93%) had the highest percentage of non-Hispanic White students. The average non-Hispanic White students were 67% and half the states had less than 71% non-Hispanic White students.
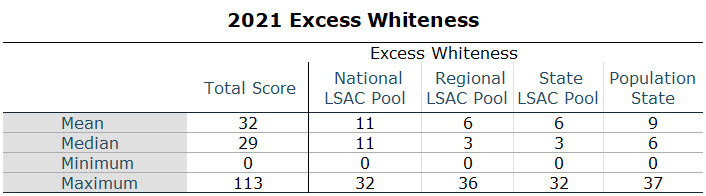
In this calculation, 139 schools (69.5%) had more non-Hispanic Whites in their first-year class than in the state population. Of the 139 law schools with Excess Whiteness, the minimum number of points was 1. The maximum number of Excess Whiteness was 32. The average number of Excess Whiteness points was 12. Half the schools had more than 12 Excess Whiteness points.
| State of Law School | Percent of State Population White | State of Law School | Percent of State Population White |
| Alabama | 65 | Montana | 86 |
| Arizona | 54 | Nebraska | 78 |
| Arkansas | 72 | Nevada | 48 |
| California | 37 | New Hampshire | 90 |
| Colorado | 68 | New Jersey | 55 |
| Connecticut | 66 | New Mexico | 37 |
| Delaware | 62 | New York | 56 |
| District of Columbia | 38 | North Carolina | 63 |
| Florida | 53 | North Dakota | 84 |
| Georgia | 52 | Ohio | 79 |
| Hawaii | 22 | Oklahoma | 65 |
| Idaho | 82 | Oregon | 75 |
| Illinois | 61 | Pennsylvania | 76 |
| Indiana | 79 | Puerto Rico | 2 |
| Iowa | 85 | Rhode Island | 72 |
| Kansas | 76 | South Carolina | 64 |
| Kentucky | 84 | South Dakota | 82 |
| Louisiana | 58 | Tennessee | 74 |
| Maine | 93 | Texas | 41 |
| Maryland | 50 | Utah | 78 |
| Massachusetts | 71 | Vermont | 93 |
| Michigan | 75 | Virginia | 61 |
| Minnesota | 79 | Washington | 68 |
| Mississippi | 56 | West Virginia | 92 |
| Missouri | 79 | Wisconsin | 81 |
| Wyoming | 84 |
Correlations
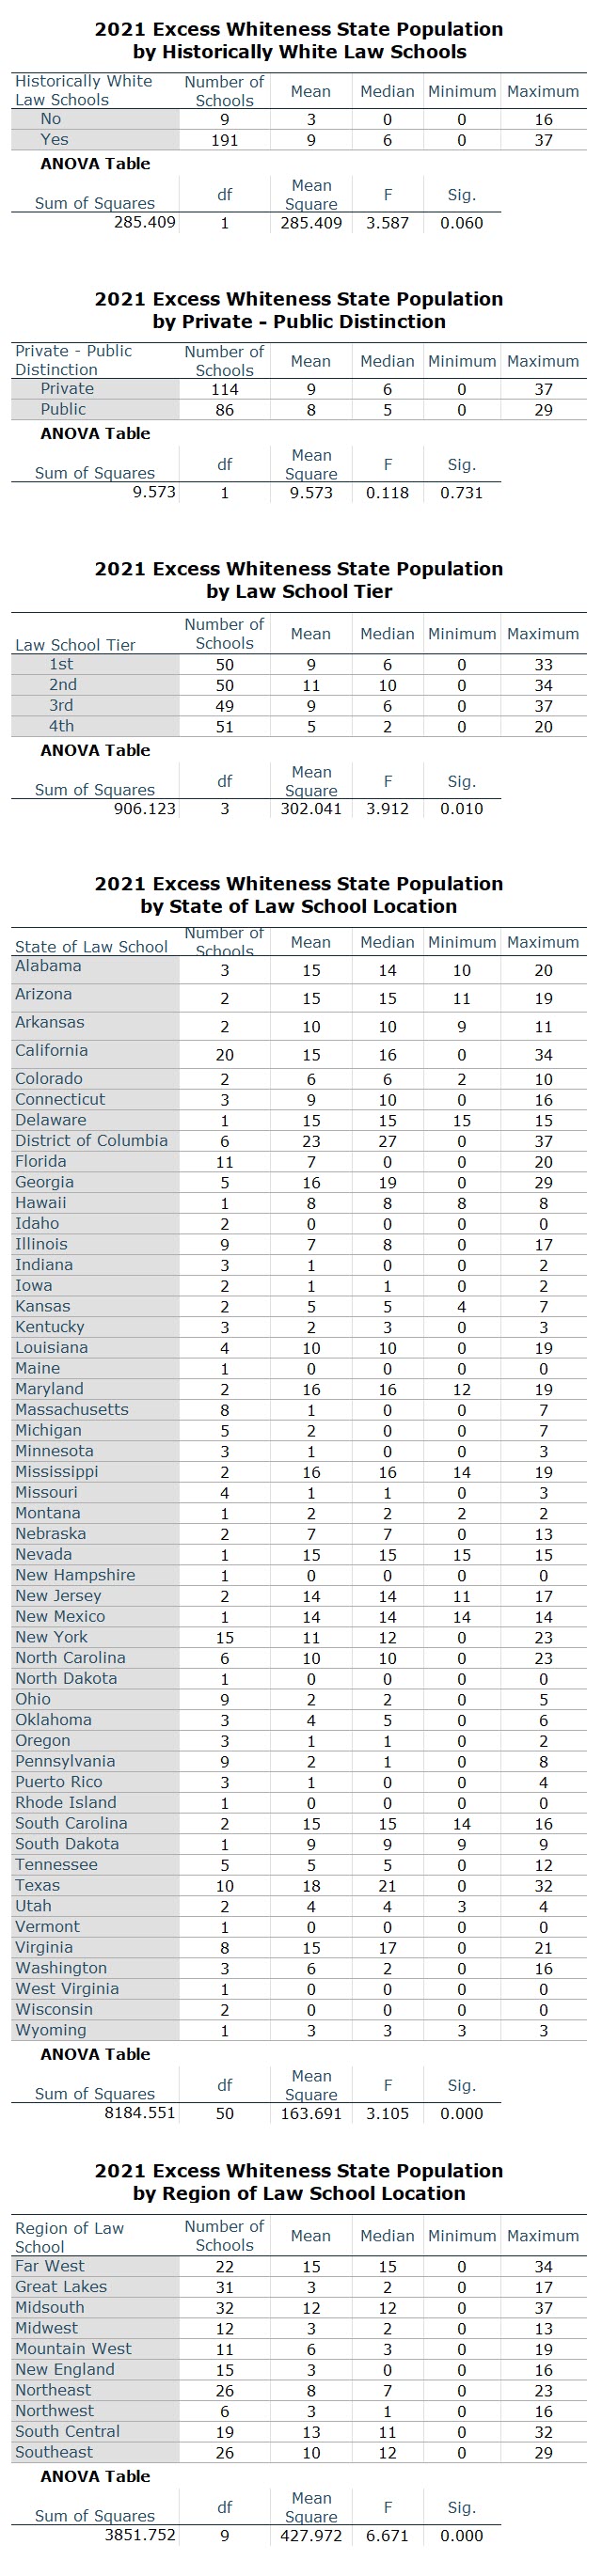
- Historically White Law Schools. Historically White law schools (9) had a higher mean Excess Whiteness than non-historically white law schools (3). The difference was not statistically significant (p=.06)
. - Public vs. Private. Private law schools had higher Excess Whiteness scores (9) than public law schools (8). However, the difference was not statistically significant (p=.731).
- Tier. Second-tier law schools had the most Excess Whiteness (11), and fourth tiers had the least (5). The difference was statistically significant (p=.01).
- States. There was a difference in mean among states. The District of Columbia had the highest mean excess Whiteness (23). The states of Idaho, Maine, New Hampshire, North Dakota, Rhode Island, Vermont, West Virginia, and Wisconsin had a mean Excess Whiteness of 0. The difference among states was statistically significant (p=.000).
- Regions. The Great Lakes, Midwest, New England, and Northwest had the lowest mean Excess Whiteness (3 points). The Far West had the highest (15) (p=.000).
Charts and Tables
 |
The State Population and Excess Whiteness Database
This database includes all 200 schools. It can be sorted by columns and searched. Click on a row for additional information.
Legend: TWLS The Whitest Law School; EW Excess Whiteness; TW Total Whiteness; FY First Year; LSAC Law School Admission Council; Pop Population.